

The 7th annual BC Craft Beer Survey ran during the month of November, when over 1000 submissions were received providing insight on BC beer + cider consumers’ opinions. Questions about specific breweries and beers were asked in an open-ended fashion so as to ensure that there was no bias involved.
The information presented below is intended to be understandable in general terms, but also as statistically relevant as possible. If you have questions about how the data was prepared or what anything means, please leave your comments at the bottom of this article.
Thank you to all of our sponsors who contributed prizing associated with the survey! Additionally, don’t forget to check out our 2019 People’s Choice Awards, and stay tuned for an analysis of trends from the past 7 years.
2019 BC Craft Beer Survey Results Analyzed
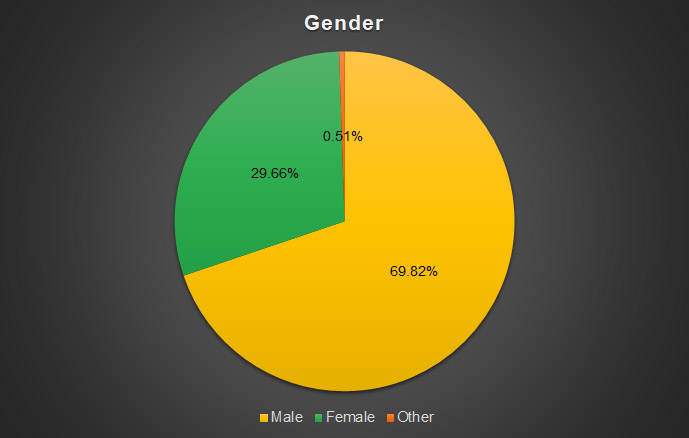
Gender of Survey Respondents
This year, 30% of respondents were female while 7% were male. For the second year, we included a third option where 0.5% of respondents selected “other”.
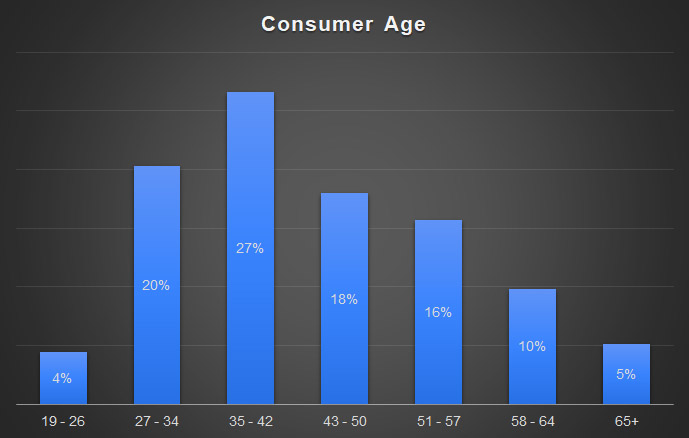
Age of Survey Respondents
Given the legal drinking age of 19 in British Columbia, anyone that selected being 18 or younger was disqualified from the survey. In this year’s survey the median and mode values fall in the 35-42 age category. The largest demographic group contributing to the survey is in the 35-42 age group followed by 27-34. If you look at all consumers between the ages of 27 and 50, that is 65% of all respondents.
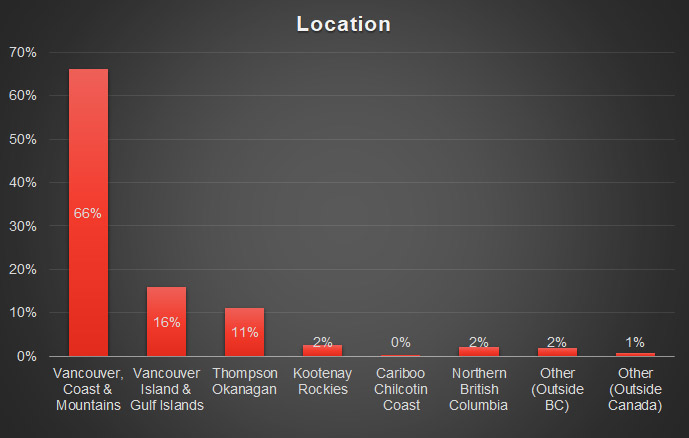
Location of Survey Respondents
The location of respondents was collected as the BC government breaks down regions of the province. By far, the largest group comes from greater Vancouver followed by Vancouver Island and the Okanagan. Compared to past surveys we saw a lower response rate from Vancouver Island which could skew results slightly.
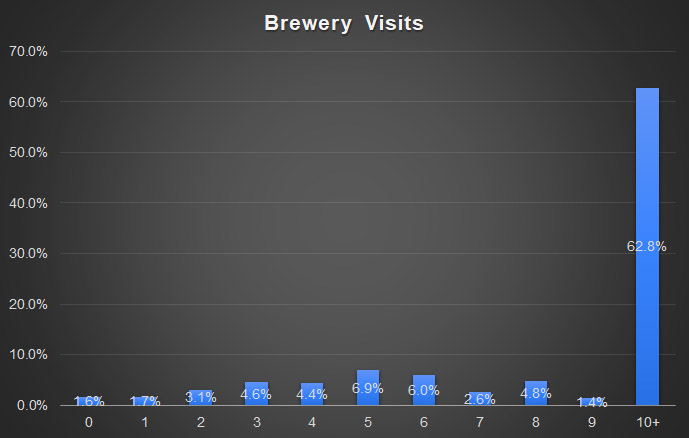
Number of Breweries visited in Past 12 Months
Here, 63% of all respondents reported visiting 10+ breweries over the past year. Interestingly we do see a bell-curve to the results peaking at 5 when observing the number of breweries visited from 0-9. This likely illustrates two different consumer segments that are responding to the survey. Those segments being the craft beer curious vs the craft beer enthusiast.
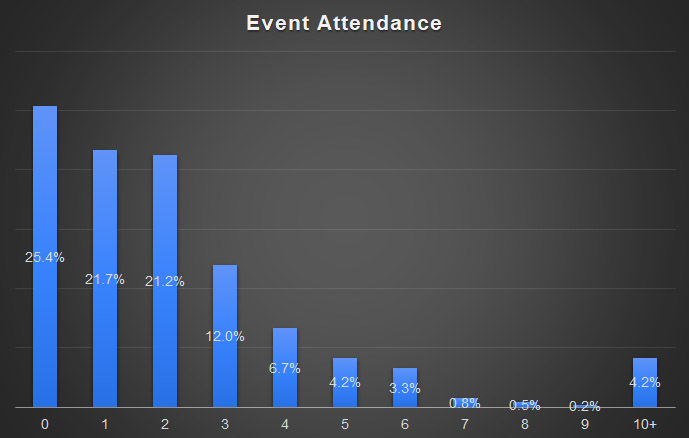
Number of Beer Events Attended in Past 12 Months
The number of beer events attended has been declining over the past few years (more on that to come). When asked about the number of events attended the largest segment attended zero events followed by two events and one event. The mean value of events attended is 2.2 where anyone that selected 10+ events is counted as 10.
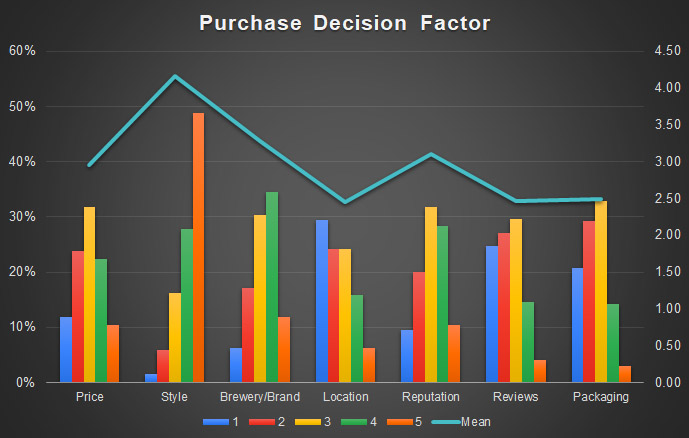
Beer Purchase Decision Factor Importance
In measuring the purchase decision factor we ask respondents how important each factor is on a scale of 1-5 when they are purchasing beer. Each bar in the graph below represents the percentage of respondents that answered a specific number. The line represents the mean (average) importance for each factor. The most important factor is style, followed by reputation, brewery/brand and price. Location, reviews and packaging are all similarly ranked below the top 4 factors.
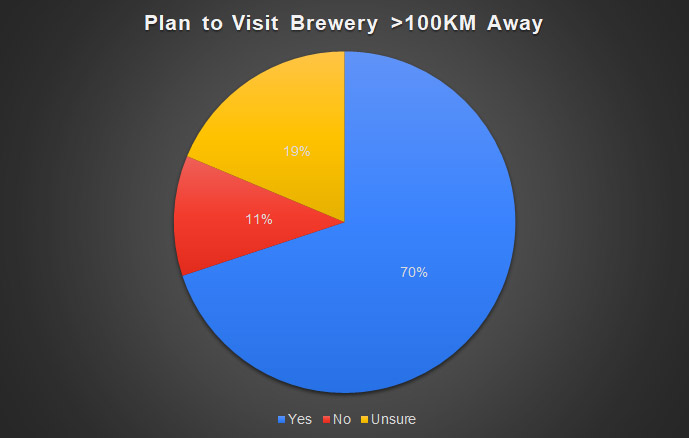
Plan to Visit Brewery >100km From Home in Next 12 Months
When asked if planning to visit a brewery greater than 100km from their home in the next 12 months, 70% of respondents answered yes. This question is meant to be an indication of the tourism impact that craft beer has in British Columbia.
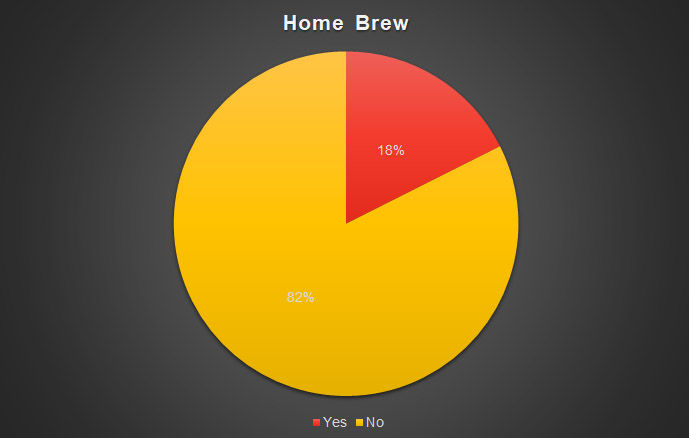
Have Brewed at Home in Past 12 Months
In the past 12 months, 18% of survey respondents have brewed their own beer at a home brew scale. This is down a few percentage points from the 2018 survey.
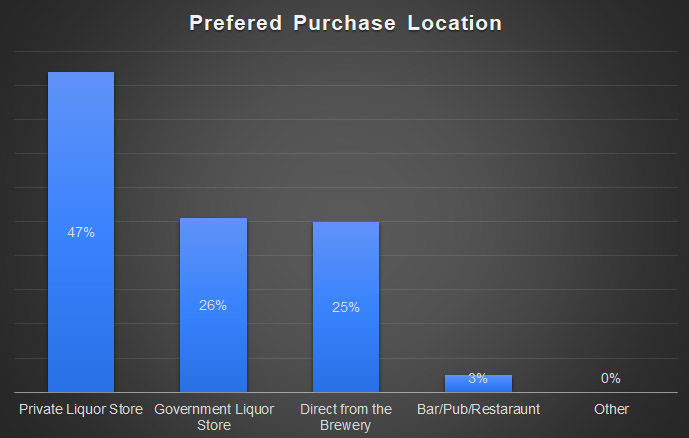
Preferred Beer Purchase Location
Craft beer consumers continue to prefer to purchase beer from Private Liquor Stores. This year, government run BC Liquor Stores and direct brewery purchases came in at 1/4 of the responses each. Pubs and restaurants were in a distant 4th place this year with only 3% of responses.
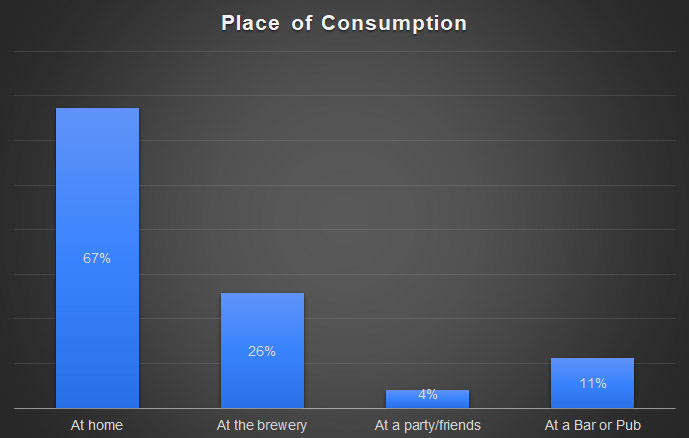
Primary Place of Consumption
When asked where respondents primary consumed beer, 67% stated home, followed by At The Brewery with 26% of all responses. We continue to see an increase in the “at the brewery” category aligning with the local consumer and more breweries opening each year.
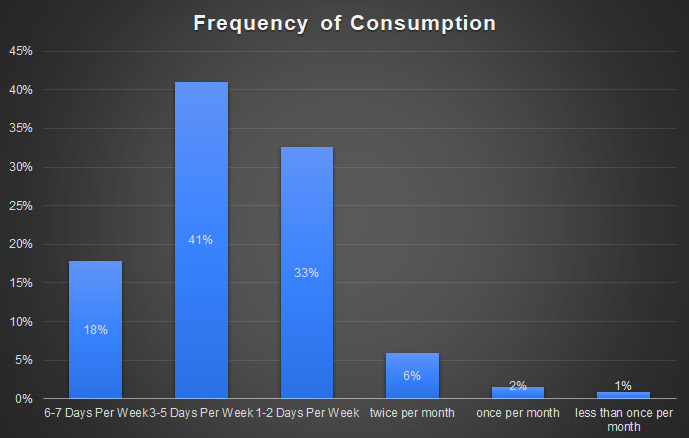
Frequency of Beer Consumption
The mean, median and mode response for how often beer is consumed from survey respondents is 3-5 days per week with 92% of all respondents indicating that they drink beer at least once per week.
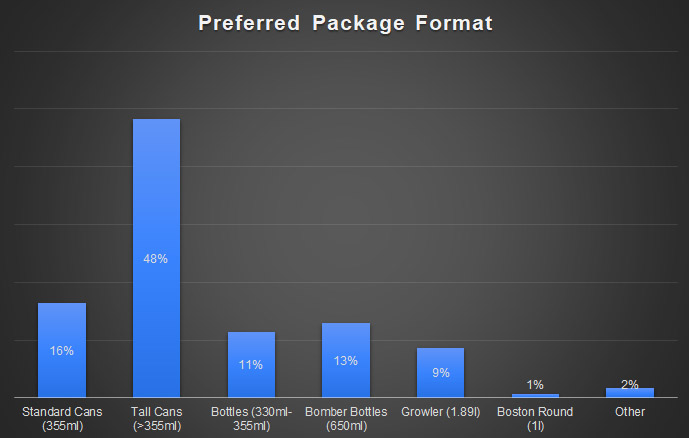
Preferred Beer Packaging Format
The preferences of package format have changes drastically since we started this survey. This year 48% of all respondents prefer tall cans and nearly 65% of all respondents prefer aluminum cans over glass. Bottles and growlers have declined significantly over the past few years.
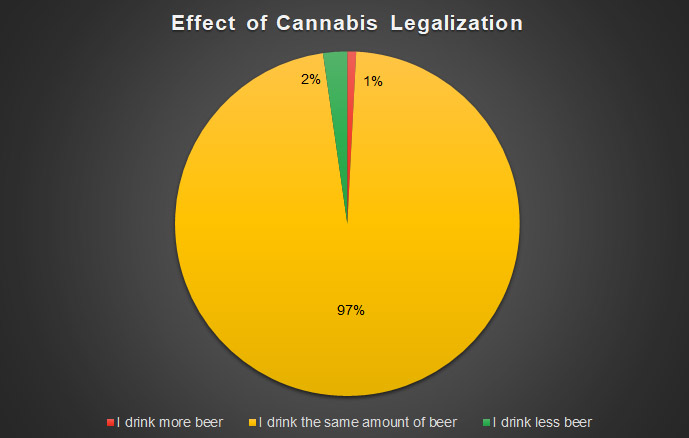
Consumption Effect of Cannabis on Beer
It has been over a year since cannabis was legalized and we asked consumers how it had affected their beer consumption. Responding to this question, only 2% of consumers reported drinking less beer as a result of cannabis.
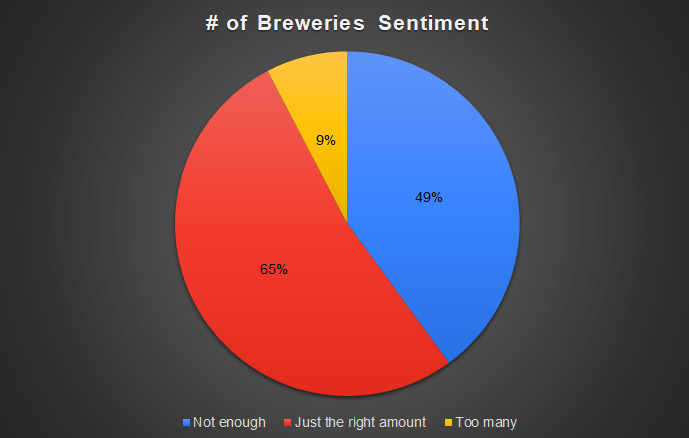
Consumer Sentiment Around Quantity of BC Breweries
There are mixed opinions over how many breweries BC can actually support and just how many we should have. In this year’s survey 65% reported having the right amount of breweries while 49% would like to see more. 9% of all respondents reported there being too many breweries operating in BC.
Favourite Beer Style
In an open ended question, Beer Me BC asked consumers what their favourite style of beer was. By a wide margin, once again, IPA was the preferred style of respondents with Sours holding on to second spot. The Hazy IPA subcategory jumped up to 3rd spot, knocking Stout down to 4th place.
- India Pale Ale
- Sour Ale
- Hazy IPA
- Stout
- Pale Ale
- Lager
- Pilsner
- Saison
- Porter
- Wheat Ale
Least Favourite Beer Style
The favourite and least favourite styles actually look pretty similar which shows how divisive craft beer can be. Sour Ales took top spot here followed by Lagers, IPAs, Stouts and the Saison. The order is mixed up a bit but 9 styles appear in both lists.
- Sour Ale
- Lager
- India Pale Ale
- Stout
- Saison
- Pilsner
- Porter
- Wheat Ale
- Adjunct Lager
- Hazy IPA
Thank you to everyone that contributed to this year’s survey. Your responses are greatly appreciated in reporting on the state of craft beer in BC. Stay tuned for an article on trends looking at our past 7 years of data, and where things are heading next.

Would be nice to have prior years info for comparison
Visit this link for all prior years’ results, including a seven-year comparative analysis:
https://beermebc.com/category/knowledge/survey/
…and now we’ve published our Seven Year Trends article. It’s exactly what you wanted.
https://beermebc.com/2019/12/18/bc-craft-beer-trends/
Thanks for the comment, that was handy!
Style will always determine what I drink but pricing is starting to make a difference. When a pint served at a pub or a brewery is the same price point as a 650ml take home bottle I don’t question the pubs pricing. $7-$8 is getting a bit much.