

BC Craft Beer Trends – 2013 to 2018 Consumer Survey Data Analyzed
After starting the BC Craft Beer Survey in 2013, we have collected data every year making 2018 the 6th annual survey. In an attempt to be as statically accurate as possible, the majority of the questions asked have remaind verbatim. This allows us to look at the year over year data and attempt to extrapolate trend over the 6 years of data to better understand the BC craft beer consumer.
Every survey has bias, and this is no exception. The survey respondents are generally actively engaged in the BC craft beer market. As a result the data is a representation of the op-pinons of BC craft beer drinkers, not the whole of British Columbians. As the proportion of people drinking craft beer grows there is also a shifting demographic of people that is engaged and potentially answering this survey.
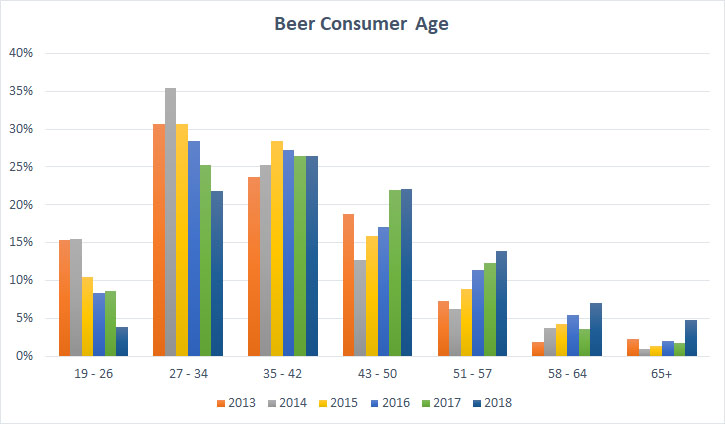
The first data point to look at is the age of respondents. Over the past 6 years we have seen that the largest cohort has shifted from the 27-34 group to the 35-42 group. In fact the overall age of respondents has been trending older. While there are more people entering the craft beer marketplace that are of an older age, we are also observing the same group of consumers getting older. Since starting the survey, someone that was in the 27-34 age range has now likely moved from to the 35-42 range. Similarly, the 19-26 category has been shrinking significantly, now representing less than 5% of the total. This is likely related to that group moving to the 27-34 group and a lack of new beer consumer entering inside the age bracket.
Looking at the frequency of which craft beer drinkers consume, the results have been relatively stable over the past 6 years. The largest group of consumers continue to drink beer 3-5 days per week. While the numbers have been relatively stable there has been a slight overall shift towards consuming less often.

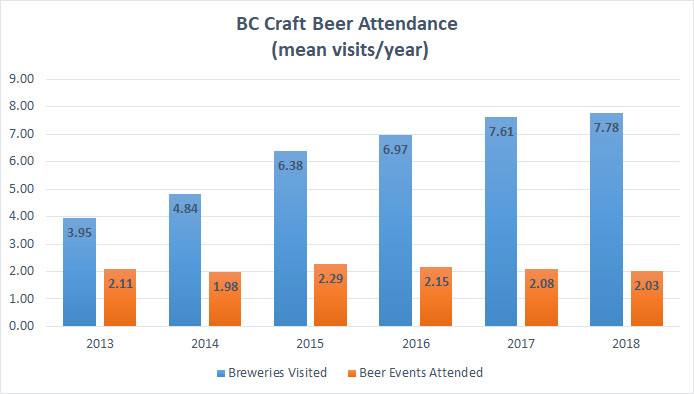
Looking at the number of breweries and events that consumers are attending each year we see a relatively flat interest in events. The number of beer events attended has not changed significantly since starting this survey. Looking at the number of breweries visited though, we see a slowing rate of growth. What was around a 25% growth rate early on, appears to be flattening growing by ony 2.2% year over year in 2018.
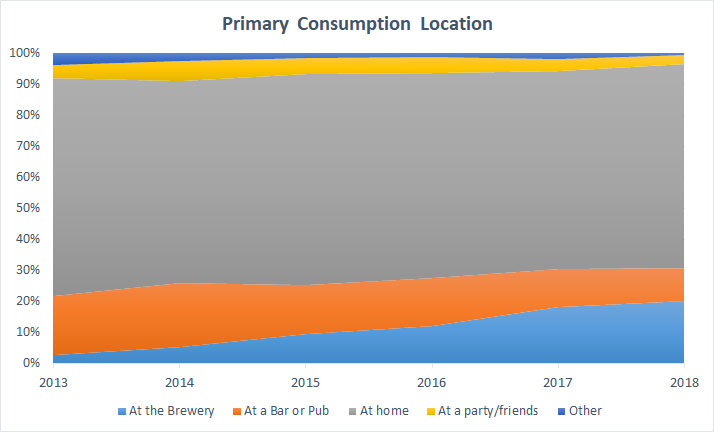
Looking at the primary location of consumption for BC craft beer consumers we are looking at it a bit differently. By Using a Stacked Column Graph we ca see the relative growth or shrinking of the different location categories. Most notably here you can see that consumption at the brewery has continued to grow at the expense of bars and pubs. The social occasion appears to have shifted from traditional on-premise locations to the brewery itself. Consumption at home still continues to be the primary point of consumption but has seen a slight decline in its dominance over the past 6 years.
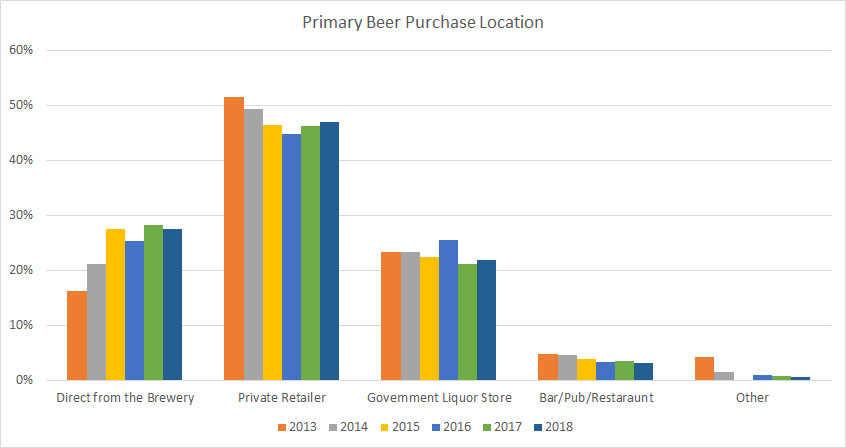
In looking at the location where craft beer consumers prefer to purchase beer, the private retailer continues to be the top venue. Purchases from the brewery have continued to rise, but much like the number of breweries visited, appears to be leveling off. Offsetting the growth in direct brewery sales it appears to have been shared between both government retailers, private retailers and on-premise locations.
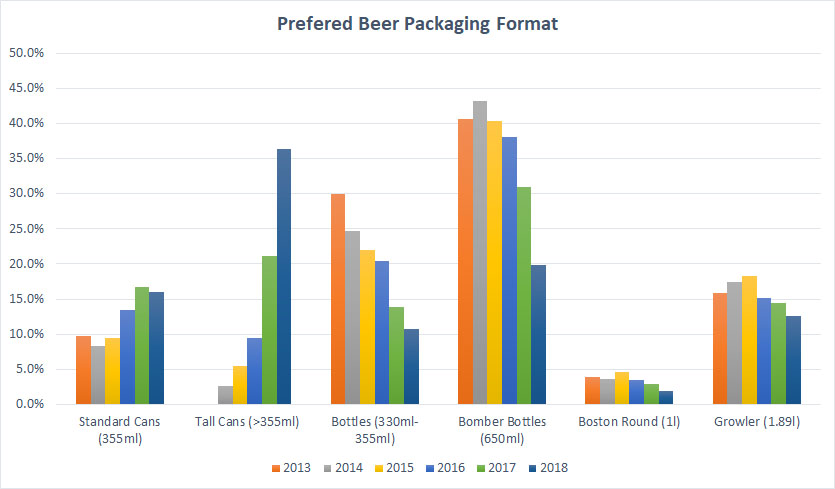
2018 saw a major acceleration in the trends of preferred purchase formats. While the bomber bottle was well into decline and cans had been trending upwards, in 2018 the Tall can nearly doubled to take over as the preferred format. More than 35% of consumers prefer the tall can while bomber bottles now represent only 20% of the market preference.
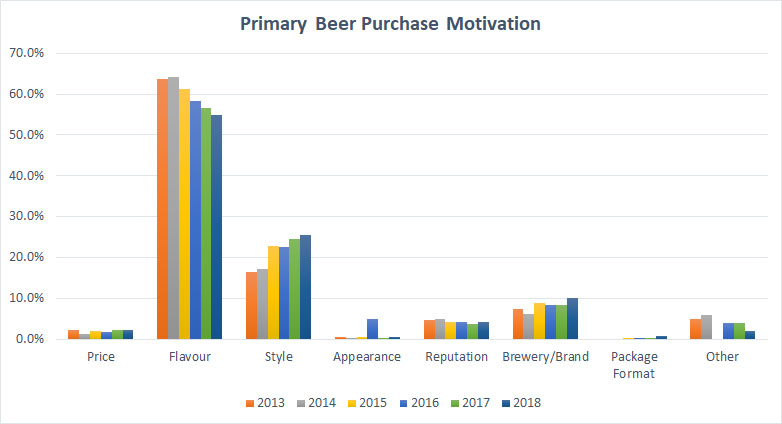
Looking at the most important factor for consumers when purchasing beer, flavour remains well at the top but continues to decline. With around 55% of the total, we see style and brewery/brand consistently growing in importance.
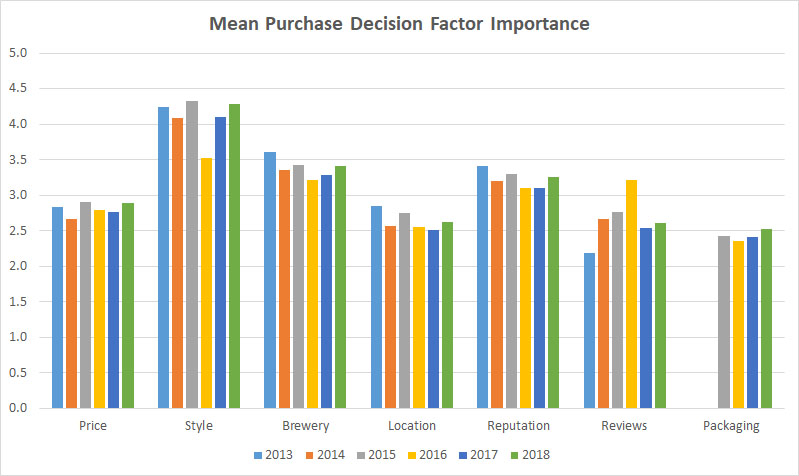
In ranking the importance of several purchase decision factors, we asked survey respondents to rank 7 factors on a scale of 1 to 5. Below you will see the mean (average) score for each factor over the 6 years. In this graph you will see that there is relative stability across importance rankings. The most notable trends include a decrease in the importance of brewery, location and reputation while there is a slight increase in the importance of price and packaging.
A lot has changed since we started this survey started back in 2013 we have seen more than 100 breweries open their doors, a small handfull close their doors, and a few change hands. 2019 will be a very interesting, and tasty year as a craft beer drinker.
Thank you to everyone that participated and to the businesses that provided prizing including Vancouver Brewery Tours, R&B, Field House, Beer League, Howe Sound, Trading Post, THree Ranges, Dead Frog, Red Racer, Andina & Strange Fellows.
Leave your questions and comments below about this article!
Our thanks to Vancouver Brewery Tours, R&B, Field House, Beer League, Howe Sound, Trading Post, Three Ranges, Dead Frog, Red Racer, Andina and Strange Fellows.

![]()

![]()
![]()
BC Beer Consumer Demographics, Preferences & Opinions – 2018 BC Craft Beer Survey Results

[…] 3 – https://beermebc.com/2018/12/13/2018-bc-craft-beer-trends-6-years-of-consumer-data-visualized/ […]