

An in-depth look at craft beer sales in BC and the change in share over 24 months
People are always asking what the market share for craft beer is. This illusive number always seems to be made up of wishes and hope but there is actually a scientific method of calculating such a number.
The BCLDB, being the crown corporation that it is has a wealth of information at its fingertips; some of which it publishes into the public domain. Each quarter the BCLDB publishes a Liquor Market Review that gives an overview of sales data across all categories of liquor. One such category is beer.
In deciphering the data there are a few things to know that skew and explain the data:
- A “micro-brewery” is one that produces less than 15,000 HL of beer annually
- examples include: Bridge, Steel & Oak, Bad Tattoo, Category 12
- A “regional brewery” is one that produces between 15,000 and 350,000 HL annually
- examples include: Phillips, Parallel 49, Central City, Red Truck, Driftwood
- A “commercial brewery” is one that produces greater than 350,000 HL annually
- examples include: Coors, Budweiser, Corona, Kokanee
- Categories are listed as being BC, Canada (excluding BC) and imports
- All imports are lumped together and not distinguished as craft
- The numbers listed are in litres of beer. There are 100L in 1HL
Because of these points when we calculate the market share for craft beer in BC we are calculating beer that is sold by Canadian breweries of less than 350,000HL as a percentage of all beer sold. Any US breweries that are importing into Canada and considered “craft” would be included in the commercial classification as a result of how the data is reported. This will result in a minimal understatement of craft share. Also, brands such as Cariboo will be reported as craft based on the size of the brewery producing them (less than 350,000HL per annum). By the BCLDB definition of craft they are in fact a craft brewery so contribute to the craft beer market share.
Compiling the quarterly data from the past 2 years we can then plot the change in beer market share based on the volumes reported. The data in each column represents the end of each quarter (Dec-15 is the quarter ending Dec. 31, 2015).This is what that data looks like:
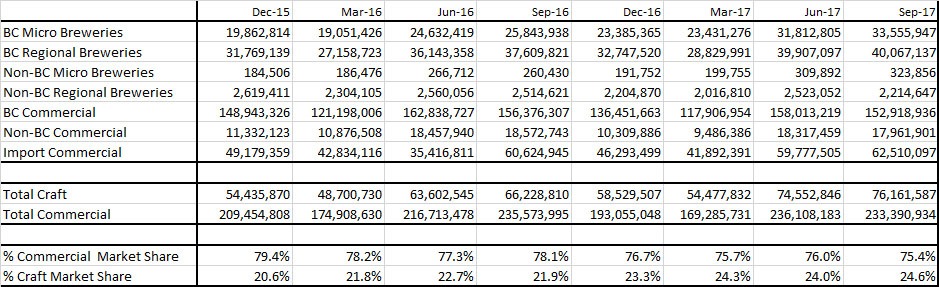
Analyzing the data we see that over the course of 24 months craft beer has grown from 20.6% to 24.6%. That is an average of .25% per quarter. The share is not increasing evenly over time however with quarterly share changing per quarter between -0.7% and +1.2%.
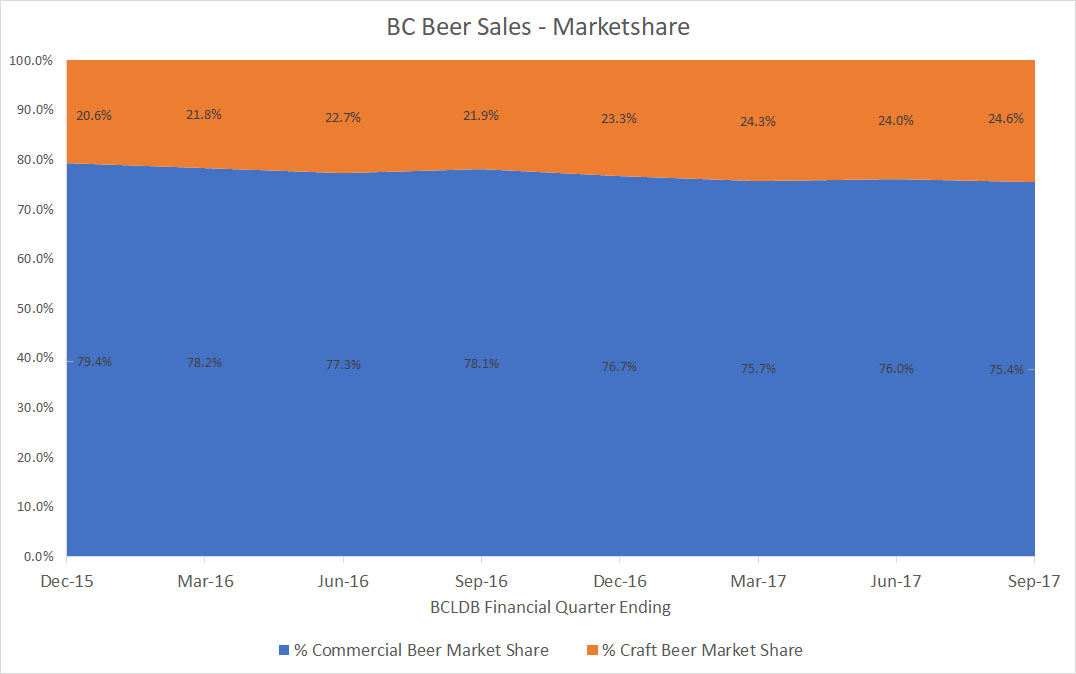
Graphically showing the share as a proportion of all beer sales we can see the slow and methodical increase in overall beer sales shifting towards craft.
Have questions about this data, analysis or what the numbers mean? Leave a comment below.

I was going over the numbers to see where the trend continued, and noticed that your sales volumes per quarter are significantly higher than what I’m finding reported. The most I’m seeing is approximately 60 Million Litres sold per quarter, where you have amounts in excess of 300 Million litres. Did you calculate a moving average or were some of the numbers you pulled annual figures?